
For the last couple of months I’ve had an Octopus Home Mini in the house. I thought I’d share some first impressions.


Firstly, what is it?
It’s a small pink device that is designed to give you a more detailed view of your current energy usage, as measured by your smart meter.
It does this by connecting to both the “Home Area Network” (HAN) that is part of your smart meter installation AND your wifi. It then acts as a bridge between the two, pushing readings from your smart meter to a remote service. In this case Octopus system and their mobile app.
While smart meters allow your energy supplier to read them whenever they want, in practice they don’t do this constantly. Smart meters are only required to store data for half-hourly periods, so even if your supplier was constantly checking they wouldn’t be able to get a real-time view of your usage.
Devices on the HAN can read the electricity meter every 10 seconds. This is how your In-Home Display (IHD) is able to give you a more real-time view of your usage.
Note you can’t read gas meters this often as they’re not designed to do that. You can only get half-hourly readings from them.
So the Octopus Mini basically acts likes an IHD, but it just pushes the data to the cloud, so the readings can be displayed in an app rather than a physical device in some corner of your home.
The functionality of IHDs is all part of the SMETS smart meter standards. This means they’re all pretty similar, but doesn’t give much scope for doing anything innovative with them.
The Octopus Mini is one of a few “Consumer Access Devices” that allows pushing of near real-time usage to the cloud. You can read a bit more about this in my post about the UK’s smart meter data infrastructure.
Setting it up
Setting up the Mini is intended to be quite straight-forward. There’s a video that describes the process: install the Octopus app, scan a QR code to pop open the installation process, and then enter your wifi details. Job done.
Although it didn’t work for me immediately: the QR code to launch the setup process didn’t work on my new Android phone. It seemed that the camera mode I had selected wouldn’t automatically read the QR code.
Using a third-party QR code reader didn’t work as the setup process relies on the app hooking into the OS somewhere to trap the URL and launch the setup screen. There’s no way to start the install without that. After resetting my camera options I finally got it working.
Once I did manage to get it set up it’s been working without any problems.
I’ve had one period when it lost connection to the smart meter, but my IHD did at the same time. Otherwise it’s been running for about 2.5 months without losing connection.
What are my first impressions?
Positives:
- It runs better than my IHD. I’ve had to restart my IHD a few times in the last 2.5 months. The Mini seems much more reliable by comparison
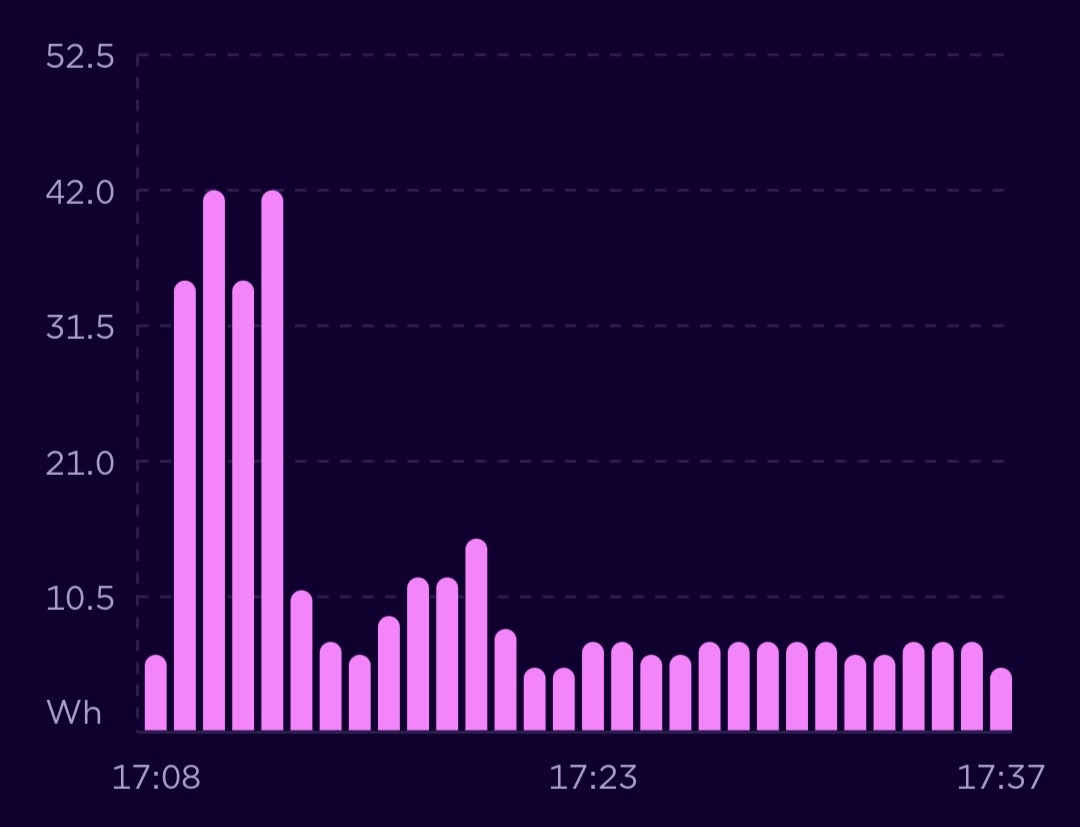
- The graph view is much better than my IHD, which just show a single recent reading. The Octopus app currently gives you a view of the last 5 minutes (updated every 10s or so) or the last 30 minutes (updated every few minutes). Being able to see recent usage if you’re trying to your energy usage
- If you are doing some baseload checks, then it’s easier to wander round with the phone than the IHD
I don’t have solar panels, but I believe you can get insights into your solar exports if you do.
Negatives:
- There’s no way to pause the graphs. They just update forever
- There’s no history. There’s nothing beyond that 30 minute view. I would like to see my whole day’s usage at a more detailed level
- The data isn’t integrated into the website. I can only use the app.
- There’s no export option. The website allows you to export your smart meter readings, but I can’t do this for the data from the Mini
The above are really only negatives for energy data nerds.
My main disappointment is the app doesn’t let me do anything with that more detailed data. For example:
- Why not let me set an alert, so that if my usage goes above a threshold, I get a notification? Help me identify my periods of high usage, devices that might need replacing, or encourage my to shift my usage to periods of lower carbon intensity
- Give me a more detailed report of my usage. The Octopus website already tells you the half-hourly period during which you consume most electricity. What about a more detailed view?
- What tariffs are possible now that Octopus has more detailed data?
The device is still in beta, so hopefully some of the above might come at a later date. If I were Octopus, I’d be prioritising getting the connectivity and data infrastructure right first.
My final suggestion for them is to run this beta programme with more user input. So far I’ve not been asked to provide any feedback on my experiences, which is surprising.
I’ll try and find a way to share this blog post with them.
